Kinetiq
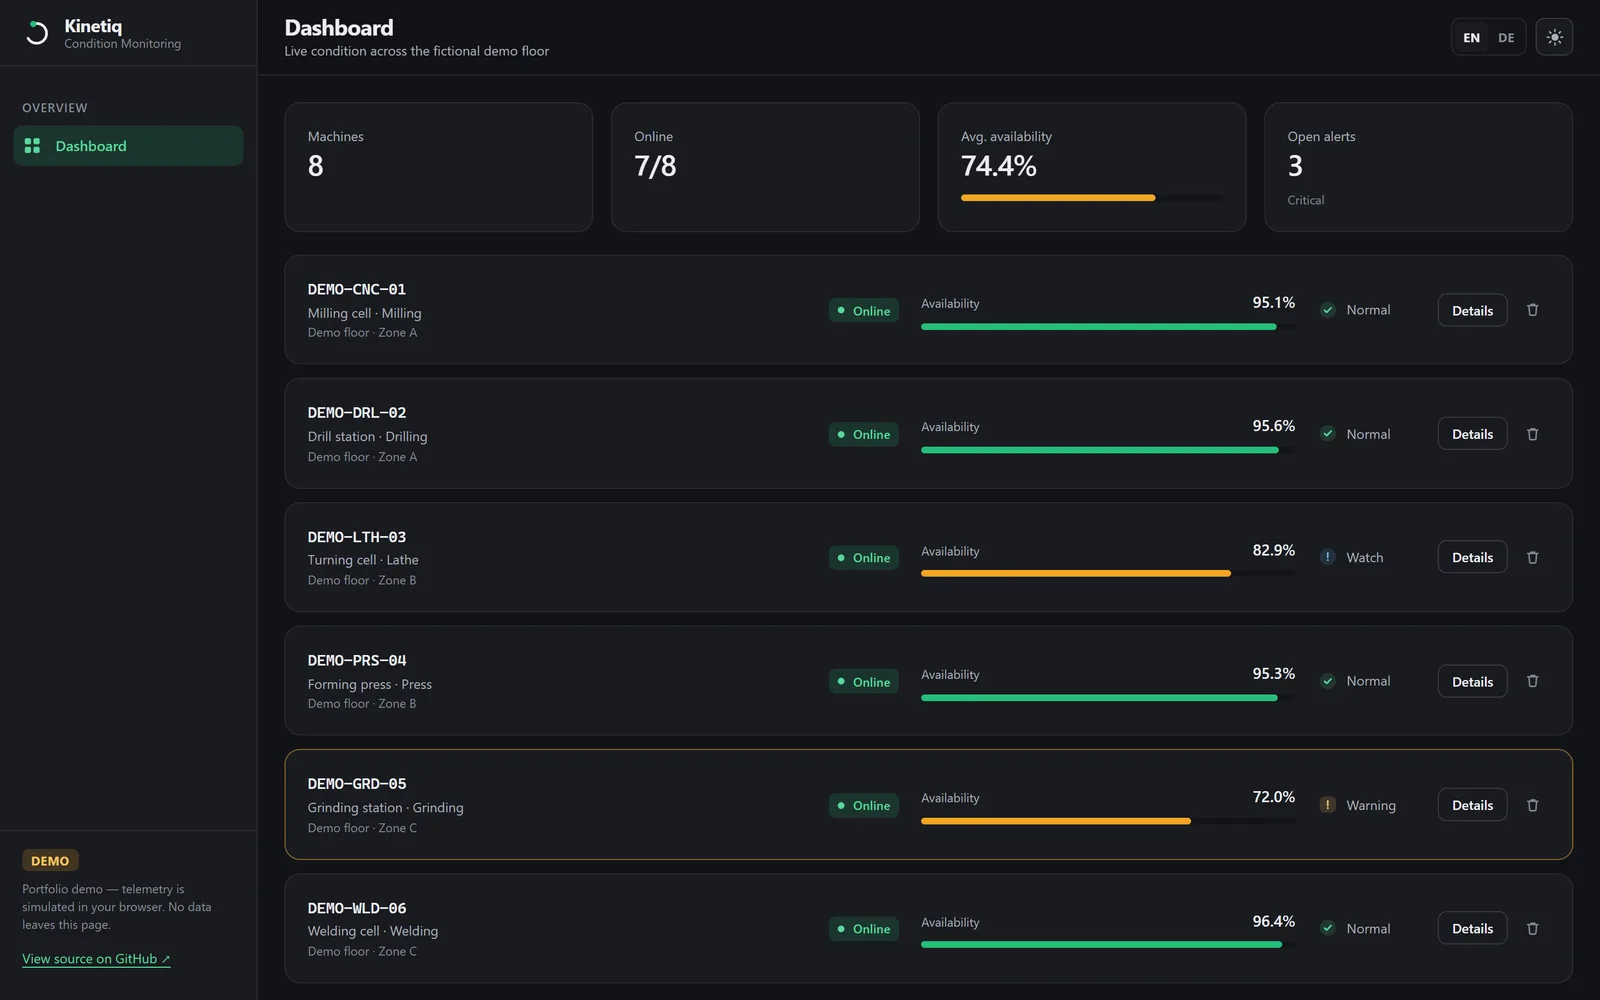
Industrial condition-monitoring dashboard - a public rebuild of a factory-floor product
- Runtime dependencies
- 4 - vue, pinia, vue-router, vue-i18n
- UI primitives
- 14, hand-built, no component or chart library
- Pipeline
- verify → audit → deploy → verify the deployed version
- Languages
- English and German, full parity
- Largest JS chunk
- 69.26 KB gzipped in the current build
- Role
- Sole developer - the original frontend and its integrations, then this standalone demo
- Client
- Originally a German industrial manufacturer; the demo is mine
- Stack
- Vue 3TypeScriptPiniavue-i18nVitestGitHub Actions
Where it comes from
In 2023 I built the frontend for a machine condition-monitoring system deployed inside a German manufacturer's plant. It read sensor telemetry out of an InfluxDB time series and published operator commands - maintenance mode, fault logging, the training hyperparameters of the model behind it - back to the factory over MQTT. That made it a control surface, not a report. Getting MQTT to work from a browser was the hardest part: the protocol expects a raw TCP socket, so it had to be carried over WebSocket with a Node-only client polyfilled for the bundler.
That codebase is private and client-owned. Kinetiq shares none of its code or data. It is a separate rebuild with fictional machines, so the interface and the engineering approach can be inspected without exposing anyone's plant.
One data seam, one clock
Stores speak in domain terms and never learn where data lives. A single TelemetrySource interface stands between them and the source, so the browser simulator, Firestore, or the production InfluxDB and MQTT transport are swappable without touching a page. Demo telemetry is a pure function of machine, field and wall-clock time - reloading does not teleport a machine into a different condition, and two open tabs agree.
A single ref-counted timer drives every live value, so the whole interface describes the same instant and pauses when the tab is hidden. The system it replaced polled the database once per second from every open page independently.
Accessibility as a constraint, asserted
Severity is encoded in icon shape and text as well as colour; touch targets grow on coarse pointers; dialogs name themselves, trap Tab, close on Escape and hand focus back to whatever opened them. Those are the claims the README makes, and they are the kind that quietly stop being true, so the component tests assert each one directly.